| หมวดสินค้า |
|---|
|
ทั้งหมด (1148) สินค้าไม่มีหมวดหมู่ (7) |
| เข้าสู่ระบบ |
|---|
| ตะกร้าสินค้าของคุณ |
|---|
| ไม่มีสินค้าในตะกร้า |
| สินค้าขายดี |
|---|
 มอเตอร์ไฟฟ้า 350w มีเกียทดในตัว 1:5 18-24Volt ค่าส่งปรับใหม่ถูกมาก
1,000 บาท
มอเตอร์ไฟฟ้า 350w มีเกียทดในตัว 1:5 18-24Volt ค่าส่งปรับใหม่ถูกมาก
1,000 บาท
 แผ่นปริ๊นอเนกประสงค์ถูกมาก 18cm*30cm
150 บาท
แผ่นปริ๊นอเนกประสงค์ถูกมาก 18cm*30cm
150 บาท
แยกตัวลูก4ตัวรีโมท2อัน") ชุด relay 12vไร้สายวิทยุ 500-3000m (คุมไฟฟ้า5-220v 30A)แยกตัวลูก4ตัวรีโมท2อัน
2,000 บาท
ชุด relay 12vไร้สายวิทยุ 500-3000m (คุมไฟฟ้า5-220v 30A)แยกตัวลูก4ตัวรีโมท2อัน
2,000 บาท
 กลอนไฟฟ้า12Vแบบดูด 60KG สำหรับ ทำประตูไฟฟ้า
800
450 บาท
กลอนไฟฟ้า12Vแบบดูด 60KG สำหรับ ทำประตูไฟฟ้า
800
450 บาท
 -40% -40% มิเตอร์วัดvolt+แสดงระดับแบต+เทอร์โมมิเตอร์2จุดในรถและนอกรถ + นาฬิกา 4in1
800
220 บาท
-50%
มิเตอร์วัดvolt+แสดงระดับแบต+เทอร์โมมิเตอร์2จุดในรถและนอกรถ + นาฬิกา 4in1
800
220 บาท
-50% F-Taobao.png "sensor แบบ ENCODE มีพัลออกมา 100pulse/REV ใช้วัดความเร็ว ระยะทาง") sensor แบบ ENCODE มีพัลออกมา 100pulse/REV ใช้วัดความเร็ว ระยะทาง
200 บาท
sensor แบบ ENCODE มีพัลออกมา 100pulse/REV ใช้วัดความเร็ว ระยะทาง
200 บาท
 JACK BANANA แจ๊คกล้วยตัวผู้ สำหรับต่อมิเตอร์ สีดำ แดงราคาต่อตัว
10 บาท
JACK BANANA แจ๊คกล้วยตัวผู้ สำหรับต่อมิเตอร์ สีดำ แดงราคาต่อตัว
10 บาท
 36V 350W ตัวควบคุม DC motor ชนิดมีแปรงถ่าน
950
480 บาท
36V 350W ตัวควบคุม DC motor ชนิดมีแปรงถ่าน
950
480 บาท
 โมดูลบันทึกเสียง 18 วิ ISD1820 ใช้งานง่าย พร้อมลำโพง
110 บาท
โมดูลบันทึกเสียง 18 วิ ISD1820 ใช้งานง่าย พร้อมลำโพง
110 บาท
 ตัวแสดงผลน้ำหนัก 0.04kg-500kg มีoutput on/off relayได้ USB โปรแกรมบนคอมด้วย
8,000
2,500 บาท
-60%
ตัวแสดงผลน้ำหนัก 0.04kg-500kg มีoutput on/off relayได้ USB โปรแกรมบนคอมด้วย
8,000
2,500 บาท
-60% ดิจิตอลโวลต์และแอมมิเตอร์ แบบ AC220V 100A วัดได้สูงสุด 300v
580 บาท
ดิจิตอลโวลต์และแอมมิเตอร์ แบบ AC220V 100A วัดได้สูงสุด 300v
580 บาท
-淘宝网.jpg "ดิจิตอลโวลต์และแอมมิเตอร์ แบบ AC วัดได้ 100A 330V") ดิจิตอลโวลต์และแอมมิเตอร์ แบบ AC วัดได้ 100A 330V
380 บาท
ดิจิตอลโวลต์และแอมมิเตอร์ แบบ AC วัดได้ 100A 330V
380 บาท
 ชิพ 16F877A 40 ขา
150 บาท
ชิพ 16F877A 40 ขา
150 บาท
 กลอนไฟฟ้า24Vแบบดูด 60KG สำหรับ ทำประตูไฟฟ้า
800
480 บาท
-30%
กลอนไฟฟ้า24Vแบบดูด 60KG สำหรับ ทำประตูไฟฟ้า
800
480 บาท
-30% ชุดขับ motor PWM DC ควบคุมความเร็วมอเตอร์ 3V 5V 1.8V 6V 12V 2A
150 บาท
ชุดขับ motor PWM DC ควบคุมความเร็วมอเตอร์ 3V 5V 1.8V 6V 12V 2A
150 บาท
 Arduino UNO R3 atmega328p AVR บอร์ดนี้ถูกสุด
150 บาท
Arduino UNO R3 atmega328p AVR บอร์ดนี้ถูกสุด
150 บาท
 สวิทช์คู่ 16A 250VAC DPDT หกฟุต - Taobao.png "switch 2 คอนแทค แยก 2 ทางinput 3จังหวะ DPDT 16A250vac") switch 2 คอนแทค แยก 2 ทางinput 3จังหวะ DPDT 16A250vac
35 บาท
switch 2 คอนแทค แยก 2 ทางinput 3จังหวะ DPDT 16A250vac
35 บาท
 sensor วัดน้ำหนัก 10kg/20kg รุ่นถูกราคาเดียวกัน
450 บาท
sensor วัดน้ำหนัก 10kg/20kg รุ่นถูกราคาเดียวกัน
450 บาท
 โมดูลแปลงไฟ volt ต่ำให้เป็นไฟvoltสูง2A
100 บาท
โมดูลแปลงไฟ volt ต่ำให้เป็นไฟvoltสูง2A
100 บาท
 วัด v วัดtemp2ตัว แสดงเวลาได้แสงสีน้ำเงิน ติดมอไซด์ได้ นิวปาเจโรติดสวยมาก
530
340 บาท
-5%
วัด v วัดtemp2ตัว แสดงเวลาได้แสงสีน้ำเงิน ติดมอไซด์ได้ นิวปาเจโรติดสวยมาก
530
340 บาท
-5%.jpg "มิเตอร์สีแดง3.2 นิ้ว กันน้ำ ติด jetski และเรือยันรถมอไซด์") มิเตอร์สีแดง3.2 นิ้ว กันน้ำ ติด jetski และเรือยันรถมอไซด์
250 บาท
มิเตอร์สีแดง3.2 นิ้ว กันน้ำ ติด jetski และเรือยันรถมอไซด์
250 บาท
 โปรแกรมชิพ ทุกชนิด และ eeprom โปรแกรมได้แยอะมากพร้อม socketครบถ้วน
2,700 บาท
โปรแกรมชิพ ทุกชนิด และ eeprom โปรแกรมได้แยอะมากพร้อม socketครบถ้วน
2,700 บาท
 ที่ขัดเคลือบรถยนต์ไฟฟ้า12v
1,200
850 บาท
-40%
ที่ขัดเคลือบรถยนต์ไฟฟ้า12v
1,200
850 บาท
-40% digital multimeter dT-9206A คุ้มมากมี3ตัวสุดท้าย
500 บาท
digital multimeter dT-9206A คุ้มมากมี3ตัวสุดท้าย
500 บาท
 ชุดขับ40A PWM DCmotor10-50vแบบกลับทางหมุนได้
1,000 บาท
ชุดขับ40A PWM DCmotor10-50vแบบกลับทางหมุนได้
1,000 บาท
 รางเฟืองหนา 1cm สำหรับ ทำ ประตูไฟฟ้า
350 บาท
รางเฟืองหนา 1cm สำหรับ ทำ ประตูไฟฟ้า
350 บาท
 เครื่องมือซ่อมแซมซ่อมยางรถจักรยานไฟฟ้า
300
100 บาท
-70%
เครื่องมือซ่อมแซมซ่อมยางรถจักรยานไฟฟ้า
300
100 บาท
-70% ลูกลอยไฟฟ้า
250 บาท
ลูกลอยไฟฟ้า
250 บาท
 วัดแบตแห้ง24v มีระดับขีดบอกแบตเหลือเท่าไหร่ รถตู้ รถบัส รถบรรทุก
150 บาท
วัดแบตแห้ง24v มีระดับขีดบอกแบตเหลือเท่าไหร่ รถตู้ รถบัส รถบรรทุก
150 บาท
 วัดความถี่HZของไฟ 220v
350 บาท
วัดความถี่HZของไฟ 220v
350 บาท
 ตุ๊กตาฮิปโปเล่น mp3 มีลำโพงในตัวติดรถยนต์ได้ของใหม่โละ stock
1,500
400 บาท
-50%
ตุ๊กตาฮิปโปเล่น mp3 มีลำโพงในตัวติดรถยนต์ได้ของใหม่โละ stock
1,500
400 บาท
-50% เครื่องโปรแกรมชิพ MCS51 แบบต่อ usb รุ่นsp200+ ล่าสุด 2013 โปรแกรมได้แยอะ
1,500
700 บาท
เครื่องโปรแกรมชิพ MCS51 แบบต่อ usb รุ่นsp200+ ล่าสุด 2013 โปรแกรมได้แยอะ
1,500
700 บาท
 ชุดขับ60A PWM DCmotor10-60vแบบกลับทางหมุนได้
1,500 บาท
ชุดขับ60A PWM DCmotor10-60vแบบกลับทางหมุนได้
1,500 บาท
 วัด v วัดtemp2ตัว แสดงเวลาได้ แสงสีแดง ติดมอไซด์ได้ นิวปาเจโรติดสวยมาก
450
330 บาท
-10%
วัด v วัดtemp2ตัว แสดงเวลาได้ แสงสีแดง ติดมอไซด์ได้ นิวปาเจโรติดสวยมาก
450
330 บาท
-10% วัดแบตแห้ง48v มีระดับขีดบอกบอกแบตว่าเหลือเท่าไหร่
150 บาท
วัดแบตแห้ง48v มีระดับขีดบอกบอกแบตว่าเหลือเท่าไหร่
150 บาท
 โมดูลแปลงไฟ volt สูงให้เป็นไฟvoltต่ำกว่า ออก3A
120 บาท
โมดูลแปลงไฟ volt สูงให้เป็นไฟvoltต่ำกว่า ออก3A
120 บาท
 Bluetooth V2.0 slave mode ใช้ไฟตั้งแต่ 3.3v-5v ได้ทุกตระกูล
350 บาท
Bluetooth V2.0 slave mode ใช้ไฟตั้งแต่ 3.3v-5v ได้ทุกตระกูล
350 บาท
 มิเตอร์24v สีแดง คุมอุณหภูมิหม้อน้ำรถมีrelayหน้าปัดสวยๆ สำหรับรถตู้ สิบล้อ รถบัส
800
550 บาท
-20%
มิเตอร์24v สีแดง คุมอุณหภูมิหม้อน้ำรถมีrelayหน้าปัดสวยๆ สำหรับรถตู้ สิบล้อ รถบัส
800
550 บาท
-20% หน้าปัดอลูมิเนียม volume มิเตอร์ สำหรับ r ปรับค่า
25 บาท
หน้าปัดอลูมิเนียม volume มิเตอร์ สำหรับ r ปรับค่า
25 บาท
 timer 220V ตั้งเวลา on/off 16Aไฟออก 220v weekly
370
290 บาท
timer 220V ตั้งเวลา on/off 16Aไฟออก 220v weekly
370
290 บาท
 มือเบรคป้องกันการลื่นไถล มี 2 ข้าง
250 บาท
มือเบรคป้องกันการลื่นไถล มี 2 ข้าง
250 บาท
 BANANA20A แจ๊คกล้วยตัวเมียสีพิเศษ สำหรับมิเตอร์ สีเขียว/เหลือง/น้ำเงิน 4มม
30 บาท
BANANA20A แจ๊คกล้วยตัวเมียสีพิเศษ สำหรับมิเตอร์ สีเขียว/เหลือง/น้ำเงิน 4มม
30 บาท
แยกตัวลูก2ตัวรีโมทส่ง 2ตัว") ชุด relay 12vไร้สาย 30-100m (5-220v 10A)แยกตัวลูก2ตัวรีโมทส่ง 2ตัว
1,100 บาท
ชุด relay 12vไร้สาย 30-100m (5-220v 10A)แยกตัวลูก2ตัวรีโมทส่ง 2ตัว
1,100 บาท
 relay 220v คุมไฟ220v10A ไร้สายผ่านคลื่นวิทยุ 1000-3000m แยกตัวลูก6ตัว
3,300 บาท
relay 220v คุมไฟ220v10A ไร้สายผ่านคลื่นวิทยุ 1000-3000m แยกตัวลูก6ตัว
3,300 บาท
 - Taobao.png "หัวหนีบปากคีบจระเข้เอาไว้หนีบวงจร ขนาดหัวถึงท้าย6cm") หัวหนีบปากคีบจระเข้เอาไว้หนีบวงจร ขนาดหัวถึงท้าย6cm
5 บาท
หัวหนีบปากคีบจระเข้เอาไว้หนีบวงจร ขนาดหัวถึงท้าย6cm
5 บาท
.jpg "วัด temp มีเวลาวันที่วัดvoltได้15vไว้ติดรถใช้แทนนาฬิกา0.56นิ้ว") วัด temp มีเวลาวันที่วัดvoltได้15vไว้ติดรถใช้แทนนาฬิกา0.56นิ้ว
250 บาท
วัด temp มีเวลาวันที่วัดvoltได้15vไว้ติดรถใช้แทนนาฬิกา0.56นิ้ว
250 บาท
 sensor loadcell วัดน้ำหนัก 100kg แบบประหยัด
100 บาท
sensor loadcell วัดน้ำหนัก 100kg แบบประหยัด
100 บาท
 วัดDC volt0-100 วัดกระแส100A ในตัวเดียวกัน ไว้ติดรถต่างๆ
480
330 บาท
วัดDC volt0-100 วัดกระแส100A ในตัวเดียวกัน ไว้ติดรถต่างๆ
480
330 บาท
 ขายถูก มอเตอร์ 350w มีเกียทด1:5 28-36Volt ถูกมาก
1,000 บาท
-20%
ขายถูก มอเตอร์ 350w มีเกียทด1:5 28-36Volt ถูกมาก
1,000 บาท
-20% |
| รับข่าวสารทางอีเมล |
|---|
| แท็ก |
|---|
| ดู VDO การทำโครงงานทั้งหมดของ อ.ประเสริฐ ตรวจสอบสถานะไปรษณีย์ |
|
ชื่อสินค้า : ตัว sensor ตรวจจับแอลกอฮอล์ ตัวเปล่าๆไม่มีวงจร ราคา:120บาท
|
|---|
|
ลากเม้าเพื่อ ดูรายละเอียดเพิ่มเติม คลิ๊กดูรูปอื่นได้ จะสั่งซื้อกดที่รถเข็นด้านขวานี้ --)
ลากเม้าเพื่อ ดูรายละเอียดเพิ่มเติม คลิ๊กดูรูปอื่นได้ จะสั่งซื้อกดที่รถเข็นด้านขวานี้ --)
ลากเม้าเพื่อ ดูรายละเอียดเพิ่มเติม คลิ๊กดูรูปอื่นได้ จะสั่งซื้อกดที่รถเข็นด้านขวานี้ --)
ลากเม้าเพื่อ ดูรายละเอียดเพิ่มเติม คลิ๊กดูรูปอื่นได้ จะสั่งซื้อกดที่รถเข็นด้านขวานี้ --)
|
| รายละเอียดสินค้า รหัสสินค้า 004007 |
|---|
|
เข้าชม : 19878 | สั่งซื้อไปแล้ว : มากกว่า5 | Wishlist Rate : 0
จำนวนในstock : stock
เพิ่มลง Wishlist
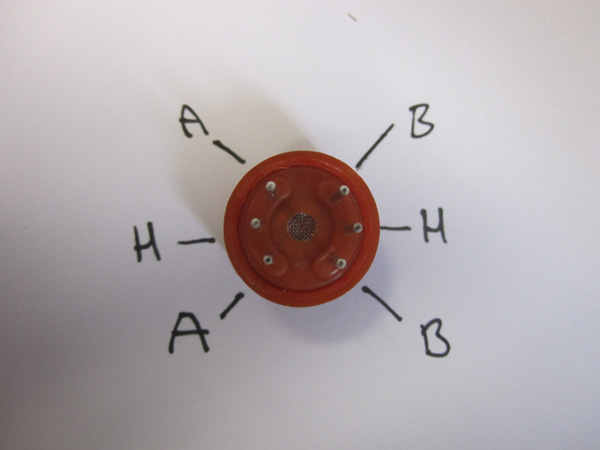
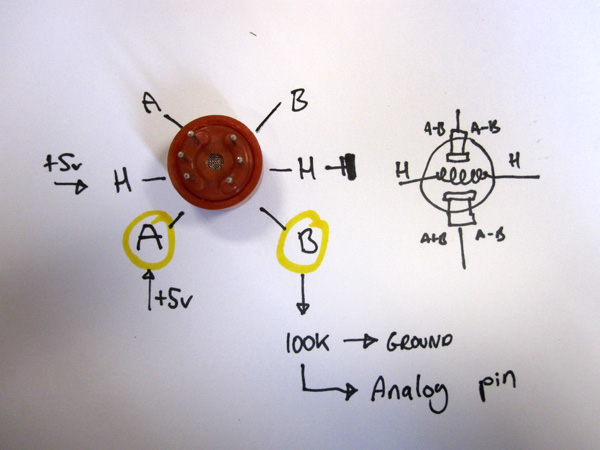
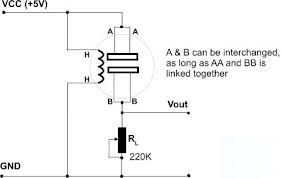
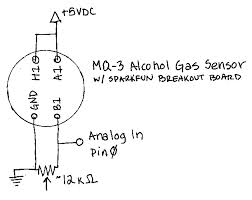
ตัว sensor ตรวจจับแอลกอฮอล์ ตัวเปล่าๆไม่มีวงจร outputออกเป็น ความต้านทาน ใช้งานง่าย การต่อทำดังนี้ ดูรูปขาที่ 2 ขา 3 กับขา 4 ต่อไฟ 5V ขา 1 ต่อกับGND ขา 2 เป็น output เป็นความต้านทานที่เปลี่ยนแปลงไปตามความเข้มของแอลกอฮอล์ ดู vdo เทส โมดูลตัวนี้ได้ที่นี่ครับ ใช้่ง่ายสุดๆ ครับ เป็นภาคทดสอบ MQ-3
Sensitive for Alcohol, Ethanol, smoke Search for datasheet: http://duckduckgo.com/?q=%22mq-3%22+gas+sensor+filetype%3Apdf รายละเอียด และ source code ดูที่http://lusorobotica.com/index.php?topic=111.0 ดู vdo โครงงานที่ผมใช้ตัวนี้ทำโปรเจคได้ครับ ตรง บทความ การตรวจจับต่างๆ ด้านบนเมนู หรือ คลิ๊กตรงนี้ได้เลยครับ ดูการคำนวนได้ใน web นี้ ผมเอามาแปะไว้นะครับ http://robotics-wr.blogspot.com/2013/03/curve-fitting-for-non-linear-alcohol.html
|
| ภาพสินค้าอื่นๆ คลิ๊กที่รูป หากต้องการ Zoom กดแว่นขยาย ลาก mouse ที่ภาพเลื่อนซ้ายขวาได้ |
|---|
|
300
ราคาสั่งจากหน้า web 120 บาท ราคาซื้อเองที่สาขา 120 บาท |
| สินค้าที่เกี่ยวข้อง |
|---|
|
electhailand@gmail.com เมล์นี้ใช้ติดตามสินค้า สั่งสินค้า และสอบถามครับ


